Market Outlook
July10, 2017
Market Cues
Domestic Indices
Chg (%)
(Pts)
(Cl ose)
Indian markets are likely to open flat tracking SGX Nifty and global indices.
BSE Sensex
(0.0)
(9)
31,361
U.S. stock indexes advanced Friday to close out the first week of July higher after an
Nifty
(0.1)
(9)
9,666
employment report showed the U.S. added 222,000 jobs in June, representing the
Mid Cap
(0.0)
(6)
14,942
second-largest job haul of the year and underscoring that the labor market remains
Small Cap
0.3
141
15,831
healthy. A strong rebound in beleaguered tech stocks also helped major
Bankex
(0.2)
(66)
26,498
benchmarks to secure a foothold in positive territory.
The Dow Jones Industrial Average DJIA, climbed 0.4%, to close at 21,414, The S&P
Global Indices
Chg (%)
(Pts)
(Cl ose)
500 index SPX, rose 0.6%, to 2,425, The Nasdaq Composite Index COMP rallied
1%, to end at 6,153.
Dow Jones
0.4
194
21,414
Nasdaq
0.1
64
6,153
The U.K stock erased earlier losses and ended slightly higher on Friday after the
FTSE
0.2
14
7350
pund gets chopped down following a trio of disappointing data. The FTSE 100 index
Nikkei
(0.3)
(65)
19,929
UKX, rose 0.2% to close at 7,351, after trading as low as 7,315 earlier in the day.
The benchmark advanced 0.5% for the week.
Hang Seng
(0.5)
(124)
25,341
Shanghai Com
0.2
6
3,218
On domestic front, The benchmark Sensex on Friday retreated from its record high
by ending lower by 9 points in a range- bound session but recorded gains for the
week on GST boost and monsoon progress. The NSE Nifty fell 0.09%, to close at
A dvances / Declines
BSE
NSE
9,665.80 after shuttling between 9,684.25 and 9,642.65.
Advances
1,383
1,851
Declines
1,319
823
News Analysis
Unchanged
130
73
IDFC Bank- Shriram Group Merger
Detailed analysis is on Pg2
Volumes (` Cr)
Investor’s Ready Reckoner
BSE
3,358
Key Domestic & Global Indicators
NSE
24,161
Stock Watch: Latest investment recommendations on 150+ stocks
Refer Pg6 onwards
#Net Inflows (` Cr)
Ne t
Mtd
Ytd
Top Picks
FII
(56606
(1,324)
54,585
C MP
Target
Upside
C ompany
Sector
R ating
MFs
8208
1,346
40,492
(`)
(`)
(%)
Blue Star
Capital Goods
Buy
603
760
26.1
Dewan Housing FinanceFinancials
Buy
436
520
19.4
Top Gainers
Price (`)
Chg (%)
Mahindra Lifespace
Real Estate
Buy
439
522
18.8
Renuka
116
20.0
Navkar Corporation
Others
Buy
207
265
28.2
Unitech
8
19.9
KEI Industrie s
Capital Goods
Accumulate
229
258
12.5
More Top Picks on Pg3
Tubeinvest
746
6.7
Prestige
282
5.5
Key Upcoming Events
Previous
C onsensus
Jpassociat
22
5.2
D ate
Region
Event Description
Reading
Expectations
Jul 10, 2017
US
Unnemployment rate
4.40
4.30
Top Losers
Price (`)
Chg (%)
Jul12, 2017
UK
Joble ss claims change
7.30
Religare
142
(5.7)
Jul 12, 2017
US
Producer Price Index (mom)
(0.70)
Jul 13, 2017
India
Industrial Production YoY
3.10
Intellect
122
(4.6)
Jul 13, 2017
US
Initial Jobless claims
248.00
245.00
Coromandel
410
(3.2)
More Events on Pg4
Edelweiss
193
(3.0)
Pageind
16,897
(2.8)
#as on 7t July, 20177
Market Outlook
July10, 2017
News Analysis
IDFC Bank- Shriram Group Merger
IDFC bank and Shriram Group’s holding firm Shriram Capital have aggressed to
merge. The management has been given 90 days to explore the merger and the
share swap ratio will be decided after that.
The entire merger process looks quite complex and even the IDFC Bank
management has said that they hope to complete the merger in 12 months,
excluding the exclusive 90 days period, if all regulatory approvals come in.
According to the deal structure, the following process might arise;
1) Shriram Capital, which is the unlisted holding company of the Shriram Group
and parent company of Shriram City Union Finance Ltd and Shriram Transport
Finance Co Ltd will merge with IDFC Ltd
2) Shriram City Union Finance Ltd, will merge with IDFC Bank Ltd
3) IDFC ltd will hold Shriram Transport Finance Co Ltd as an unlisted subsidiary.
The deal seems a positive for IDFC Bank. IDFC Bank has been struggling to
expand in the retail space ever since its transformation from an NBFC to a Bank
and the merger will allow it to access the ~1000 branches of the Shriram group
entities. This will also help meeting the priority sector lending for IDFC Bank.
IDFC Bank had got the license to start commercial banking operations from RBI,
and as per the approval IDFC Ltd needs to hold minimum 40% stake in IDFC Bank
Ltd till October 2018 and hence Shriram Transport Finance Co Ltd has not been
merged with the bank, as its large scale of operations would have resulted in the
holding of IDFC Ltd coming down below the required level. While in the absence
of the swap ratio it is not clear how much Shriram Group companies shareholders
will benefit, for IDFC Bank’s shareholders it ca be a positive outcome as it given
the much needed diversifications for the bank.
Note: Piramal Enterprises holds 20% stake in Shriram Capital and 10% each in
Shriram Transport & Shriram City Union
Economic and Political News
SEBI Restricts Use Of P-Note Derivatives
71 pending FDI proposals put on fast track
Corporate News
Tata and Essar plants in Gujarat fit for takeover: NTPC
Three Biocon products fail French Health Authority inspection
Aditya Birla Capital in fray to acquire Bharat Financial Inclusion
Sun Pharma enters into settlements on Modnafil Antitrust Litigation
Cadila Healthcare: Gets U.S. FDA approval for two drugs.
Market Outlook
July10, 2017
Top Picks ★★★★★
Market Cap
C MP
Target
Upside
C ompany
R ationale
(` Cr)
(`)
(`)
(%)
Strong growth in domestic business due to its leadership
in acute therapeutic segme nt. Alke m expects to launch
Alkem Laboratories
21,779
1,822
2,161
18.6
more products in USA, which bodes for its international
busine ss.
We expect the company would report strong profitability
Asian Granito
1,353
450
480
6.7
owing to better product mix, hi gher B2C sales and
amalgamation synergy.
Favourable outl ook for the AC industry to augur well for
Cooling products business w hich i s out pacing the market
Blue Star
5,766
603
760
26.1
growth. EMPPAC divisi on's profitability to improve once
operating environme nt turns around.
With a focus on the low and me dium income (LMI)
consumer segment, the company has increased its
Dewan Housing Finance
13,657
436
520
19.4
presence i n tier-II & III cities where the growth opportunity
is immense .
Loan growth i s likely to pick up after a sluggish FY17.
Karur Vysya Bank
8,696
144
160
11.2
Lower credit cost will help in strong bottomline growth.
Increasing share of CASA will help in NIM i mprovement.
High order book execution in EPC segment, rising B2C
KEI Industrie s
1,784
229
258
12.5
sales and higher exports to boost the revenues and
profitability
Speedier execution and speedier sales, strong revenue
Mahindra Lifespace
2,254
439
522
18.8
visibilty in short-to-long run, attractive valuations
Massive capacity expansion al ong with rail advantage at
Navkar Corporation
2,948
207
265
28.2
ICD as well CFS augurs well for the company
Strong brands and distribution network would boost
Siyaram Silk Mills
2,076
2,215
2,500
12.9
growth going ahe ad. Stock currently trade s at an
inexpensive valuation.
Market leadership in Hindi news genre and no.
2
viewership ranking in English news genre, exit from the
TV Today Network
1,524
256
344
34.6
radio busine ss, and anticipated growth in ad spe nds by
corporates to benefit the stock.
After GST, the company is expected to see higher
volume s along with improving product mix. The Gujarat
Maruti
2,24,423
7,429
8,495
14.3
plant will also enable higher operating leverage which
will be margin accretive.
Source: Company, Angel Research,
Market Outlook
July 10, 2017
Key Upcoming Events
Global economic events release calendar
Bl oomberg Data
D ate
Time
C ountry
Event Description
Unit
Period
L ast Reporte d
E stimate d
Jul 10, 2017
6:00 PM US
Unnemployment rate
%
Jun
4.40
4.30
Jul 12, 2017
2:00 PM UK
Joble ss claims change
% Change
Jun
7.30
US
Producer Price Index (mom)
% Change
Jun
(0.70)
Jul 13, 2017
5:30 PM India
Industrial Production YoY
% Change
May
3.10
6:00 PM US
Initial Jobless claims
Thousands
Jul 8
248.00
245.00
China
Exports YoY%
% Change
Jun
8.70
9.00
Jul 14, 2017
India
Imports YoY%
% Change
Jun
33.10
India
Exports YoY%
% Change
Jun
8.30
6:45 PM US
Industrial Production
%
Jun
-
0.30
6:00 PM US
Consumer price index (mom)
% Change
Jun
(0.10)
0.10
12: 00 PM India
Monthly Wholesale Prices YoY%
% Change
Jun
2.17
Jul 17, 2017
7:30 AM China
Industrial Production (YoY)
% Change
Jun
6.50
6.50
7:30 AM China
Real GDP (YoY)
% Change
2Q
6.90
6.80
Jul 18, 2017
2:30 PM Euro Zone
Euro-Zone CPI (YoY)
%
Jun F
1.30
6:00 PM US
Housi ng Starts
Thousands
Jun
1,092.00
1,170.00
Jul 19, 2017
2:00 PM UK
CPI (YoY)
% Change
Jun
2.90
6:00 PM US
Building permits
Thousands
Jun
1,168.00
1,205.00
Jul 20, 2017
7:30 PM Euro Zone
Euro-Zone Consumer Confidence
Value
Jul A
(1.30)
5:15 PM Euro Zone
ECB announces interest rates
%
Jul 20
-
Jul 24, 2017
1:00 PM Germany
PMI Services
Value
Jul P
54.00
1:00 PM Germany
PMI Manufacturing
Value
Jul P
59.60
Source: Bloomberg, Angel Research
Market Outlook
July 10, 2017
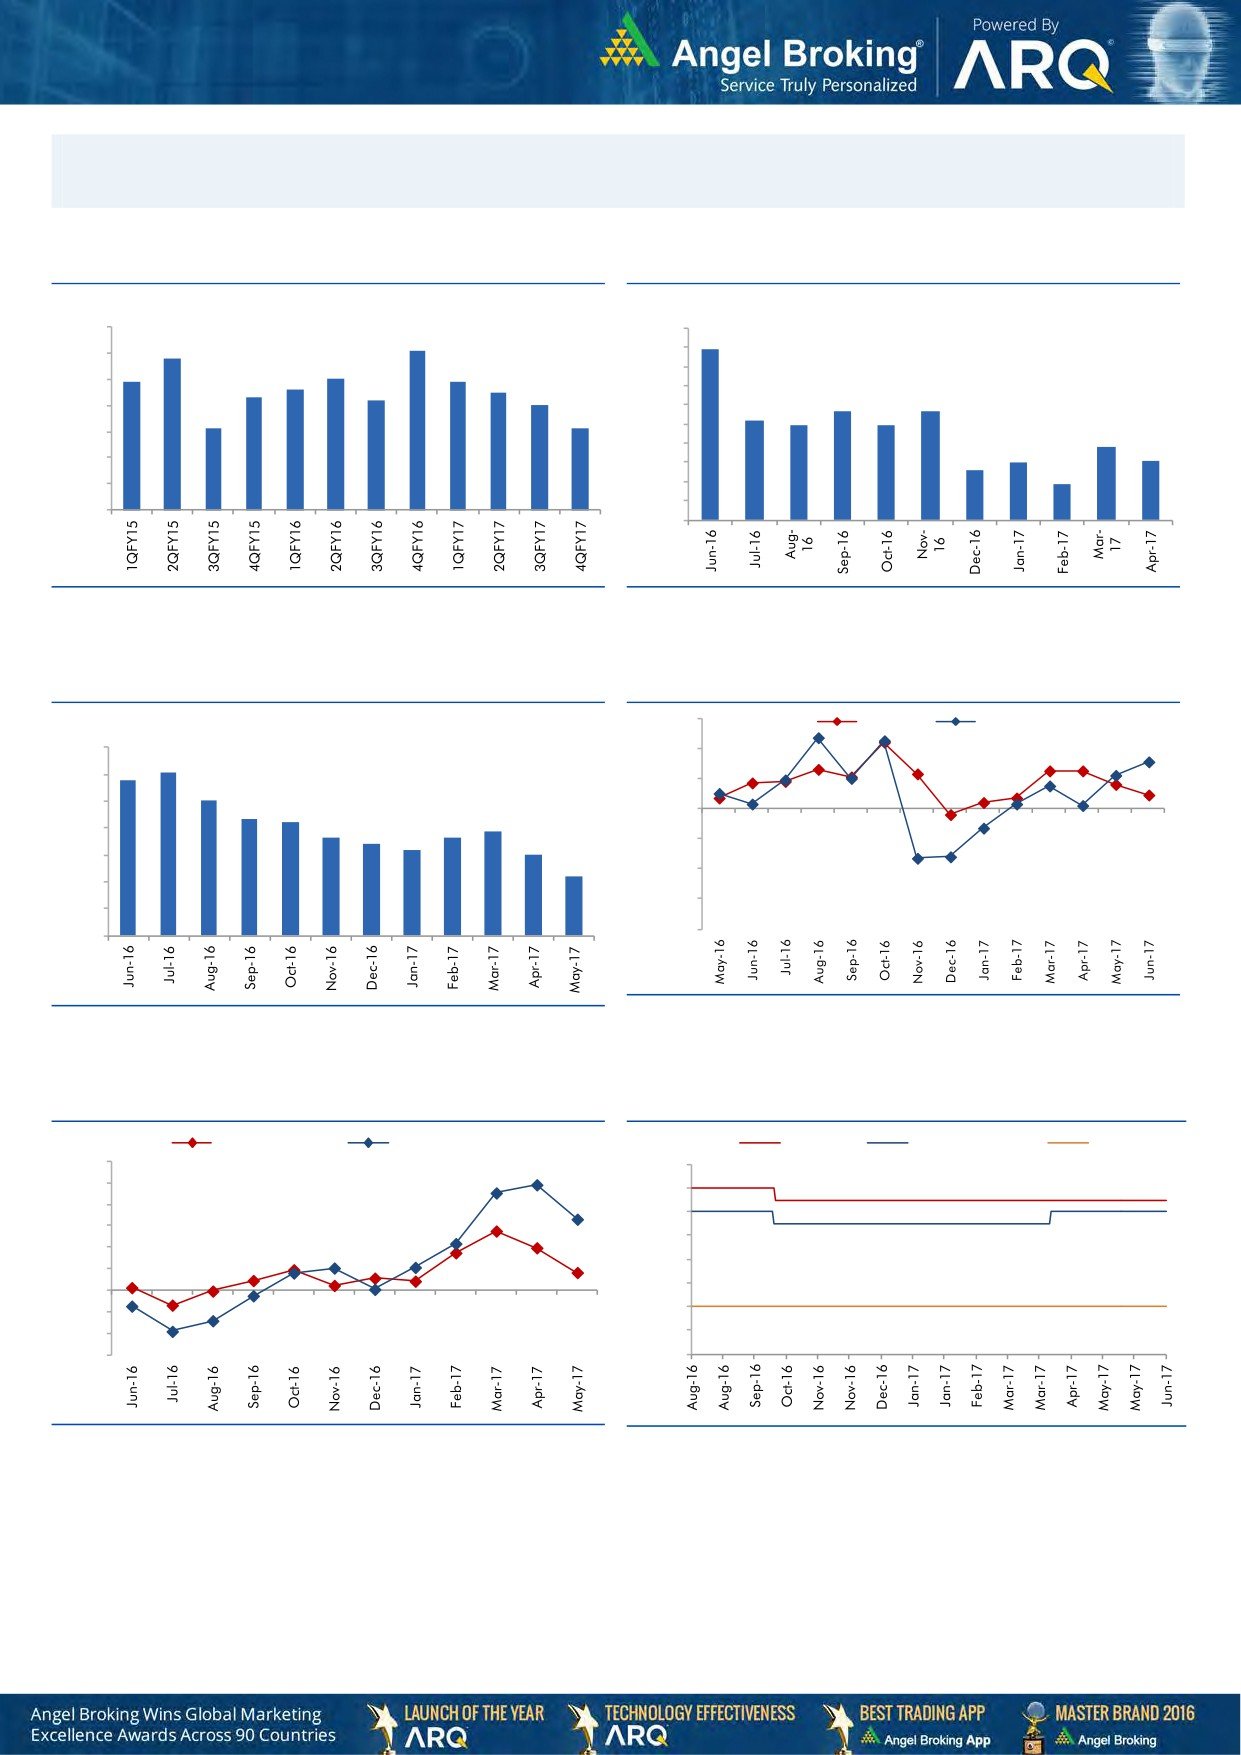
Macro watch
Exhibit 1: Quarterly GDP trends
Exhibit 2: IIP trends
(%)
(%)
10.0
10.0
9.1
8.9
8.8
9.0
9.0
7.9
8.0
7.9
8.0
7.6
7.5
8.0
7.3
7.2
7.0
7.0
5.7
5.7
7.0
6.0
5.2
6.1
6.1
4.9
4.9
5.0
6.0
3.8
4.0
3.0
3.1
5.0
2.6
3.0
1.9
4.0
2.0
1.0
3.0
-
Source: CSO, Angel Research
Source: MOSPI, Angel Research
Exhibit 3: Monthly CPI inflation trends
Exhibit 4: Manufacturing and services PMI
56.0
Mfg. PMI
Services PMI
(%)
7.0
54.0
6.1
5.8
6.0
52.0
5.1
5.0
4.3
4.2
3.9
50.0
3.6
3.7
4.0
3.4
3.2
3.0
48.0
3.0
2.2
46.0
2.0
44.0
1.0
42.0
-
Source: Market, Angel Research; Note: Level above 50 indicates expansion
Source: MOSPI, Angel Research
Exhibit 5: Exports and imports growth trends
Exhibit 6: Key policy rates
(%)
Exports yoy growth
Imports yoy growth
(%)
Repo rate
Reverse Repo rate
CRR
60.0
7.00
50.0
6.50
40.0
6.00
30.0
5.50
20.0
5.00
10.0
4.50
0.0
(10.0)
4.00
(20.0)
3.50
(30.0)
3.00
Source: Bloomberg, Angel Research
Source: RBI, Angel Research
Market Outlook
July 10, 2017
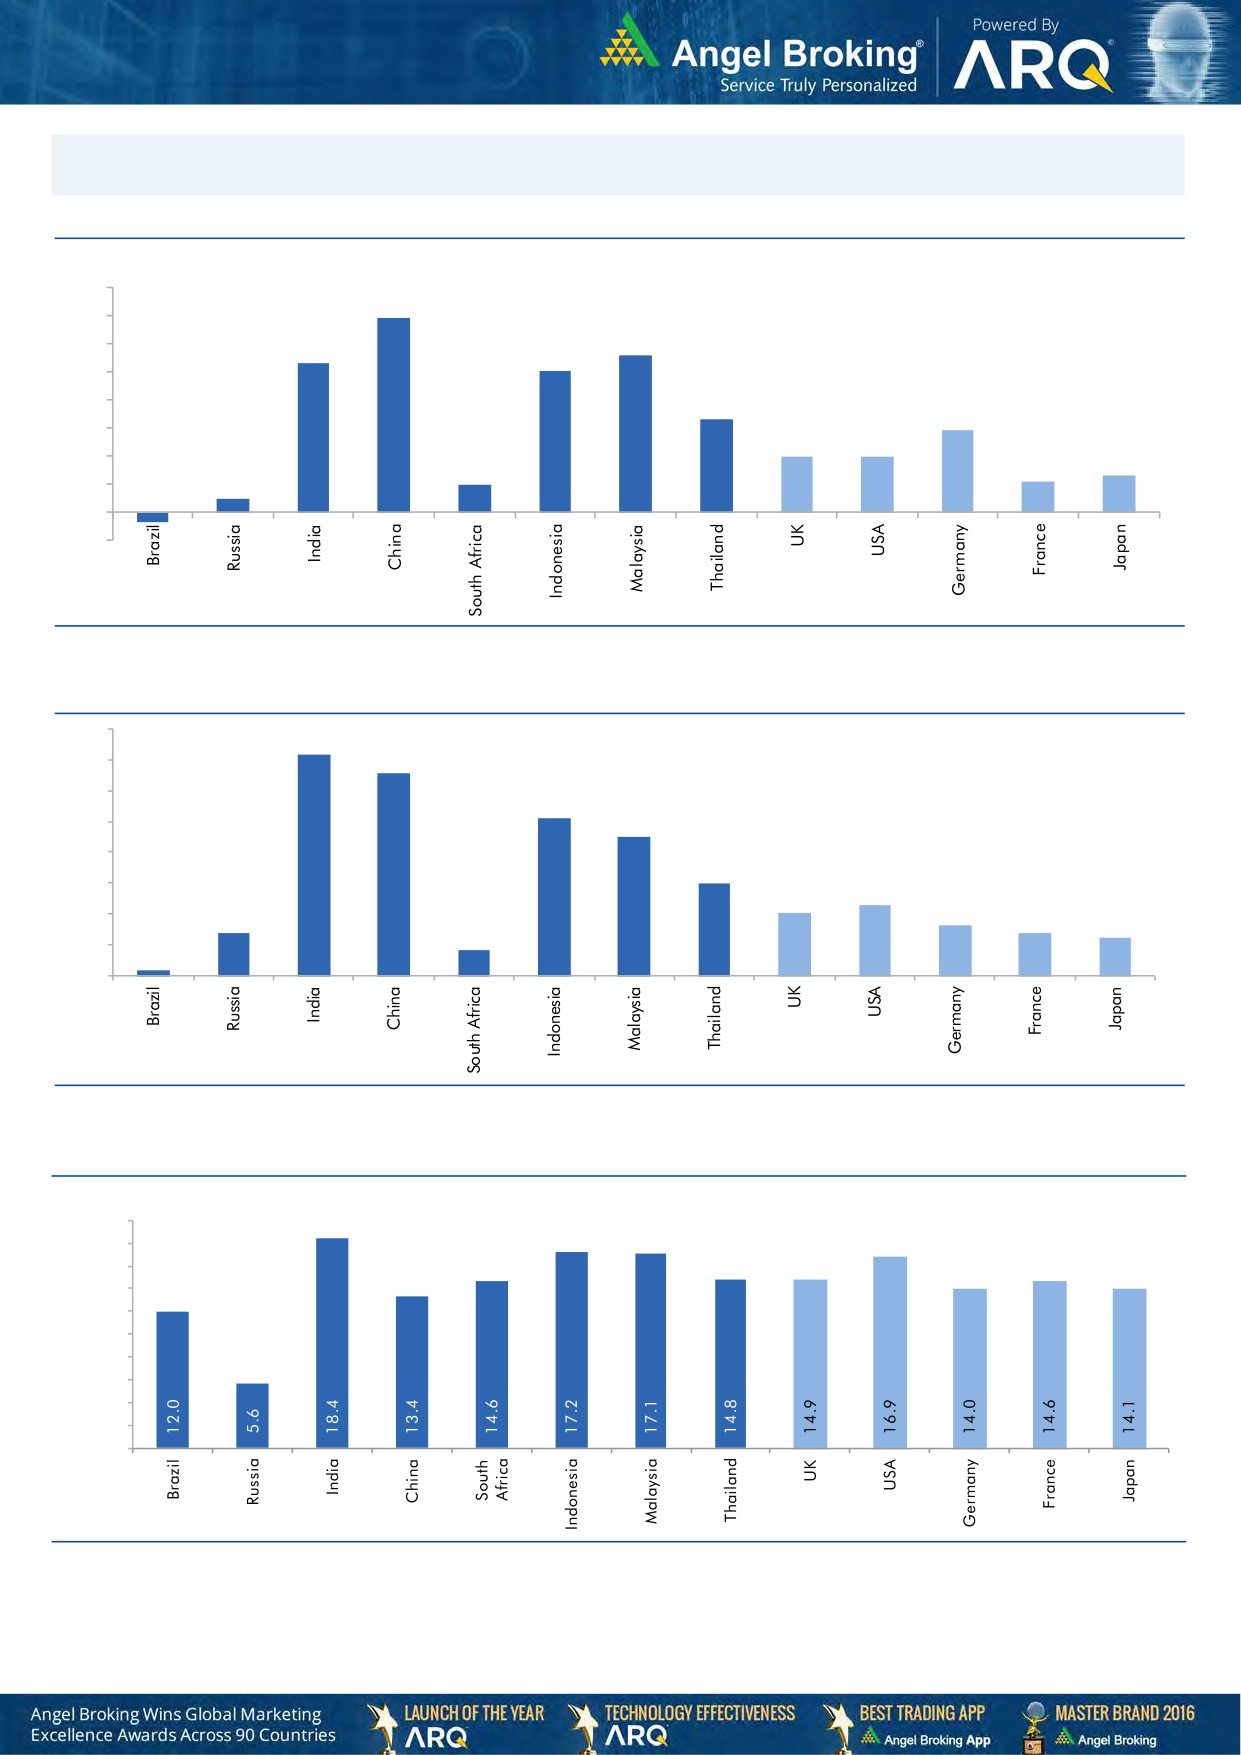
Global watch
Exhibit 1: Latest quarterly GDP Growth (%, yoy) across select developing and developed countries
(%)
8.0
6.9
7.0
5.6
6.0
5.3
5.0
1.0
5.0
4.0
3.3
2.9
3.0
2.0
2.0
0.5
2.0
1.1
1.3
1.0
-
(1.0)
(0.4)
Source: Bloomberg, Angel Research
Exhibit 2: 2016 GDP Growth projection by IMF (%, yoy) across select developing and developed countries
(%)
7.2
7.0
6.6
6.0
5.1
5.0
4.5
4.0
3.0
3.0
2.3
2.0
1.4
1.6
2.0
1.4
1.2
0.2
0.8
1.0
-
Source: IMF, Angel Research
Exhibit 3: One year forward P-E ratio across select developing and developed countries
(x)
20.0
18.0
16.0
14.0
12.0
10.0
8.0
6.0
4.0
2.0
-
Source: IMF, Angel Research
Market Outlook
July 10, 2017
Exhibit 4: Relative performance of indices across globe
Returns (%)
C ountry
Name of index
Closing price
1M
3M
1YR
Brazil
Bovespa
62,470
(0.1)
(4.4)
21.3
Russia
Micex
1,923
2.2
(5.7)
(0.1)
India
Nifty
9,675
0.3
4.3
16.1
China
Shanghai Composite
3,212
2.5
(1.6)
11.1
South Africa
Top 40
46,001
(0.5)
0.2
0.7
Mexico
Mexbol
50,016
1.6
1.4
10.2
Indonesia
LQ45
983
2.4
5.9
19.1
Malaysia
KLCI
1,771
0.4
1.7
8.7
Thailand
SET 50
994
0.5
(0.7)
9.0
USA
Dow Jones
21,320
1.1
3.5
17.8
UK
FTSE
7,337
(2.5)
0.7
11.3
Japan
Nikkei
19,994
0.1
6.3
28.4
Germany
DAX
12,381
(2.5)
0.6
24.4
France
CAC
5,152
(2.4)
1.0
17.6
Source: Bloomberg, Angel Research, as on 7t July, 2017
Stock Watch
July 10, 2017
Company Name
Reco
CMP
Target
Mkt Cap
Sales ( Čcr )
OPM(%)
EPS (Č)
PER(x)
P/BV(x)
RoE(%)
EV/Sales(x)
(Č)
Price ( Č)
( Č cr )
FY17E FY18E
FY17E
FY18E
FY17E
FY18E
FY17E
FY18E
FY17E
FY18E
FY17E
FY18E
FY17E
FY18E
Agri / Agri Chemical
Rallis
Reduce
244
209
4,736
1,937
2,164
13.3
14.3
9.0
11.0
27.1
22.1
4.7
4.1
18.4
19.8
2.5
2.2
United Phosphorus
Neutral
849
-
43,119
15,176
17,604
18.5
18.5
37.4
44.6
22.7
19.0
4.5
3.7
21.4
21.2
3.0
2.5
Auto & Auto Ancillary
Ashok Leyland
Accumulate
104
116
30,509
20,019
22,789
11.1
11.7
4.3
5.5
24.3
19.1
4.7
4.2
19.4
22.0
1.5
1.3
Bajaj Auto
Neutral
2,708
-
78,359
25,093
27,891
19.5
19.2
143.9
162.5
18.8
16.7
5.3
4.5
30.3
29.4
2.9
2.5
Bharat Forge
Neutral
1,119
-
26,052
7,726
8,713
20.5
21.2
35.3
42.7
31.7
26.2
5.9
5.3
18.9
20.1
3.4
3.0
Eicher Motors
Neutral
27,852
-
75,820
16,583
20,447
17.5
18.0
598.0
745.2
46.6
37.4
15.9
12.1
41.2
38.3
4.4
3.5
Gabriel India
Neutral
150
-
2,154
1,544
1,715
9.0
9.3
5.4
6.3
27.8
23.8
5.2
4.6
18.9
19.5
1.4
1.2
Hero Motocorp
Neutral
3,683
-
73,538
28,120
30,753
15.2
15.6
169.1
189.2
21.8
19.5
7.5
6.3
30.8
28.2
2.4
2.2
Jamna Auto Industries Neutral
265
-
2,115
1,486
1,620
9.8
9.9
15.0
17.2
17.7
15.4
3.9
3.3
21.8
21.3
1.5
1.4
L G Balakrishnan & Bros Neutral
782
-
1,228
1,302
1,432
11.6
11.9
43.7
53.0
17.9
14.8
2.5
2.3
13.8
14.2
1.0
0.9
Mahindra and Mahindra Neutral
1,375
-
85,406
46,534
53,077
11.6
11.7
67.3
78.1
20.4
17.6
3.3
2.9
15.4
15.8
1.8
1.6
Maruti
Accumulate
7,429
8,495
224,423
67,822
83,717
15.2
15.0
243.0
291.5
30.6
25.5
7.0
5.7
22.9
22.4
3.0
2.3
Minda Industries
Neutral
671
-
5,796
2,728
3,042
9.0
9.1
68.2
86.2
9.8
7.8
2.2
1.8
23.8
24.3
2.2
1.9
Motherson Sumi
Neutral
312
-
65,669
45,896
53,687
7.8
8.3
13.0
16.1
23.9
19.4
7.7
6.2
34.7
35.4
1.5
1.3
Rane Brake Lining
Neutral
1,330
-
1,053
511
562
11.3
11.5
28.1
30.9
47.4
43.0
7.2
6.6
15.3
15.0
2.2
2.0
Setco Automotive
Neutral
42
-
566
741
837
13.0
13.0
15.2
17.0
2.8
2.5
0.5
0.4
15.8
16.3
1.2
1.0
Tata Motors
Neutral
437
-
126,119
300,209
338,549
8.9
8.4
42.7
54.3
10.2
8.1
1.6
1.4
15.6
17.2
0.5
0.5
TVS Motor
Neutral
572
-
27,180
13,390
15,948
6.9
7.1
12.8
16.5
44.8
34.6
11.2
8.8
26.3
27.2
2.1
1.7
Amara Raja Batteries
Accumulate
859
962
14,669
5,339
6,220
15.9
15.3
28.0
32.3
30.7
26.6
5.9
4.9
19.1
18.5
2.8
2.4
Exide Industries
Neutral
230
-
19,550
7,439
8,307
15.0
15.0
8.1
9.3
28.4
24.7
4.0
3.6
14.3
16.7
2.2
2.0
Apollo Tyres
Neutral
258
-
13,153
12,877
14,504
14.3
13.9
21.4
23.0
12.1
11.2
1.9
1.6
16.4
15.2
1.2
1.1
Ceat
Neutral
1,900
-
7,686
7,524
8,624
13.0
12.7
131.1
144.3
14.5
13.2
2.7
2.3
19.8
18.6
1.1
1.0
JK Tyres
Neutral
169
-
3,840
7,455
8,056
15.0
15.0
21.8
24.5
7.8
6.9
1.6
1.3
22.8
21.3
0.6
0.6
Swaraj Engines
Neutral
2,337
-
2,903
660
810
15.2
16.4
54.5
72.8
42.9
32.1
13.4
12.1
31.5
39.2
4.2
3.4
Subros
Neutral
257
-
1,539
1,488
1,681
11.7
11.9
6.4
7.2
40.1
35.8
4.2
3.8
10.8
11.4
1.3
1.1
Indag Rubber
Neutral
213
-
560
286
326
19.8
16.8
11.7
13.3
18.2
16.0
3.1
2.9
17.8
17.1
1.6
1.4
Capital Goods
ACE
Neutral
74
-
733
709
814
4.1
4.6
1.4
2.1
52.9
35.3
2.2
2.1
4.4
6.0
1.2
1.0
BEML
Neutral
1,565
-
6,519
3,451
4,055
6.3
9.2
31.4
57.9
49.9
27.0
3.0
2.7
6.3
10.9
2.0
1.7
Bharat Electronics
Neutral
170
-
38,016
8,137
9,169
16.8
17.2
58.7
62.5
2.9
2.7
0.5
0.4
44.6
46.3
3.7
3.3
Stock Watch
July 10, 2017
Company Name
Reco
CMP
Target
Mkt Cap
Sales ( Čcr )
OPM(%)
EPS (Č)
PER(x)
P/BV(x)
RoE(%)
EV/Sales(x)
(Č)
Price ( Č)
( Č cr )
FY17E
FY18E
FY17E
FY18E
FY17E
FY18E
FY17E
FY18E
FY17E
FY18E
FY17E
FY18E
FY17E
FY18E
Capital Goods
Voltas
Neutral
467
-
15,452
6,511
7,514
7.9
8.7
12.9
16.3
36.2
28.7
6.5
5.7
16.7
18.5
2.1
1.8
BGR Energy
Neutral
153
-
1,101
16,567
33,848
6.0
5.6
7.8
5.9
19.6
25.9
1.1
1.1
4.7
4.2
0.2
0.1
BHEL
Neutral
135
-
33,116
28,797
34,742
-
2.8
2.3
6.9
58.8
19.6
1.0
1.0
1.3
4.8
0.8
0.6
Blue Star
Buy
603
760
5,766
4,283
5,077
5.9
7.3
14.9
22.1
40.5
27.2
7.9
6.6
20.4
26.4
1.4
1.2
CG Power and Industrial
Neutral
83
-
5,189
5,777
6,120
5.9
7.0
3.3
4.5
25.1
18.4
1.1
1.1
4.4
5.9
0.9
0.7
Solutions
Greaves Cotton
Neutral
161
-
3,923
1,755
1,881
16.8
16.9
7.8
8.5
20.6
18.9
4.1
3.8
20.6
20.9
1.9
1.8
Inox Wind
Neutral
144
-
3,206
5,605
6,267
15.7
16.4
24.8
30.0
5.8
4.8
1.6
1.2
25.9
24.4
0.6
0.5
KEC International
Neutral
267
-
6,859
9,294
10,186
7.9
8.1
9.9
11.9
27.0
22.4
4.0
3.4
15.6
16.3
1.0
0.9
KEI Industries
Accumulate
229
258
1,784
2,633
3,001
10.4
10.0
12.7
13.0
18.0
17.6
3.9
3.2
21.4
18.2
0.9
0.8
Thermax
Neutral
921
-
10,970
5,421
5,940
7.3
7.3
25.7
30.2
35.8
30.5
4.3
4.0
12.2
13.1
1.9
1.7
VATech Wabag
Neutral
670
-
3,658
3,136
3,845
8.9
9.1
26.0
35.9
25.8
18.7
3.2
2.8
13.4
15.9
1.1
0.9
Cement
ACC
Neutral
1,610
-
30,239
11,225
13,172
13.2
16.9
44.5
75.5
36.2
21.3
3.4
3.2
11.2
14.2
2.7
2.3
Ambuja Cements
Neutral
252
-
50,088
9,350
10,979
18.2
22.5
5.8
9.5
43.5
26.6
3.7
3.3
10.2
12.5
5.4
4.6
India Cements
Neutral
204
-
6,282
4,364
4,997
18.5
19.2
7.9
11.3
25.8
18.0
1.9
1.8
8.0
8.5
2.2
1.9
JK Cement
Neutral
970
-
6,784
4,398
5,173
15.5
17.5
31.2
55.5
31.1
17.5
3.7
3.2
12.0
15.5
2.1
1.7
J K Lakshmi Cement
Neutral
473
-
5,560
2,913
3,412
14.5
19.5
7.5
22.5
63.0
21.0
3.9
3.3
12.5
18.0
2.5
2.1
Orient Cement
Neutral
155
-
3,176
2,114
2,558
18.5
20.5
8.1
11.3
19.1
13.7
2.8
2.4
9.0
14.0
2.1
1.7
UltraTech Cement
Neutral
4,095
-
112,412
25,768
30,385
21.0
23.5
111.0
160.0
36.9
25.6
4.7
4.1
13.5
15.8
4.5
3.7
Construction
ITNL
Neutral
100
-
3,275
8,946
10,017
31.0
31.6
8.1
9.1
12.3
10.9
0.5
0.5
4.2
5.0
3.7
3.4
KNR Constructions
Neutral
212
-
2,974
1,385
1,673
14.7
14.0
41.2
48.5
5.1
4.4
1.0
0.8
14.9
15.2
2.2
1.8
Larsen & Toubro
Neutral
1,706
-
159,208
111,017
124,908
11.0
11.0
61.1
66.7
27.9
25.6
3.4
3.1
13.1
12.9
2.5
2.3
Gujarat Pipavav Port
Neutral
151
-
7,302
705
788
52.2
51.7
5.0
5.6
30.2
27.0
3.0
2.7
11.2
11.2
10.0
8.5
Nagarjuna Const.
Neutral
89
-
4,964
8,842
9,775
9.1
8.8
5.3
6.4
16.9
14.0
1.3
1.2
8.2
9.1
0.7
0.6
PNC Infratech
Neutral
148
-
3,796
2,350
2,904
13.1
13.2
9.0
8.8
16.4
16.8
0.6
0.5
15.9
13.9
1.7
1.4
Simplex Infra
Neutral
540
-
2,670
6,829
7,954
10.5
10.5
31.4
37.4
17.2
14.4
1.8
1.6
9.9
13.4
0.8
0.7
Power Mech Projects
Neutral
589
-
866
1,801
2,219
12.7
14.6
72.1
113.9
8.2
5.2
1.5
1.3
16.8
11.9
0.5
0.4
Sadbhav Engineering
Neutral
300
-
5,147
3,598
4,140
10.3
10.6
9.0
11.9
33.3
25.2
3.5
3.1
9.9
11.9
1.7
1.5
NBCC
Neutral
205
-
18,428
7,428
9,549
7.9
8.6
8.2
11.0
25.0
18.6
1.2
1.0
28.2
28.7
2.2
1.6
MEP Infra
Neutral
137
-
2,233
1,877
1,943
30.6
29.8
3.0
4.2
45.8
32.7
22.2
14.9
0.6
0.6
2.6
2.4
Stock Watch
July 10, 2017
Company Name
Reco
CMP
Target
Mkt Cap
Sales ( Čcr )
OPM(%)
EPS (Č)
PER(x)
P/BV(x)
RoE(%)
EV/Sales(x)
(Č)
Price ( Č)
( Č cr )
FY17E
FY18E
FY17E
FY18E
FY17E
FY18E
FY17E
FY18E
FY17E
FY18E
FY17E
FY18E
FY17E
FY18E
Construction
SIPL
Neutral
109
-
3,841
1,036
1,252
65.5
66.2
(8.4)
(5.6)
4.1
4.7
(22.8)
(15.9)
11.9
9.9
Engineers India
Neutral
155
-
10,469
1,725
1,935
16.0
19.1
11.4
13.9
13.6
11.2
1.9
1.8
13.4
15.3
5.0
4.5
Financials
Axis Bank
Buy
503
580
120,642
46,932
53,575
3.5
3.4
32.4
44.6
15.6
11.3
2.0
1.7
13.6
16.5
-
-
Bank of Baroda
Neutral
161
-
37,005
19,980
23,178
1.8
1.8
11.5
17.3
14.0
9.3
1.6
1.3
8.3
10.1
-
-
Canara Bank
Neutral
346
-
20,639
15,225
16,836
1.8
1.8
14.5
28.0
23.8
12.3
1.7
1.3
5.8
8.5
-
-
Can Fin Homes
Neutral
3,253
-
8,660
420
526
3.5
3.5
86.5
107.8
37.6
30.2
8.1
6.6
23.6
24.1
-
-
Cholamandalam Inv. &
Accumulate
1,139
1,230
17,794
2,012
2,317
6.3
6.3
42.7
53.6
26.7
21.2
4.2
3.6
16.9
18.3
-
-
Fin. Co.
Dewan Housing Finance Buy
436
520
13,657
2,225
2,688
2.9
2.9
29.7
34.6
14.7
12.6
2.4
1.6
16.1
14.8
-
-
Equitas Holdings
Buy
159
235
5,381
939
1,281
11.7
11.5
5.8
8.2
27.4
19.4
2.4
2.1
10.9
11.5
-
-
Federal Bank
Accumulate
116
125
22,441
8,259
8,995
3.0
3.0
4.3
5.6
26.9
20.6
2.3
2.1
8.5
10.1
-
-
HDFC
Neutral
1,629
-
259,514
11,475
13,450
3.4
3.4
45.3
52.5
36.0
31.0
6.9
6.1
20.2
20.5
-
-
HDFC Bank
Neutral
1,665
-
428,642
46,097
55,433
4.5
4.5
58.4
68.0
28.5
24.5
5.0
4.2
18.8
18.6
-
-
ICICI Bank
Accumulate
290
315
185,844
42,800
44,686
3.1
3.3
18.0
21.9
16.1
13.2
2.2
2.0
11.1
12.3
-
-
Karur Vysya Bank
Accumulate
144
160
8,696
5,640
6,030
3.3
3.2
8.9
10.0
16.2
14.4
1.7
1.6
11.2
11.4
-
-
Lakshmi Vilas Bank
Neutral
203
-
3,893
3,339
3,799
2.7
2.8
11.0
14.0
18.5
14.5
1.9
1.8
11.2
12.7
-
-
LIC Housing Finance
Neutral
741
-
37,393
3,712
4,293
2.6
2.5
39.0
46.0
19.0
16.1
3.6
3.0
19.9
20.1
-
-
Punjab Natl.Bank
Neutral
144
-
30,675
23,532
23,595
2.3
2.4
6.8
12.6
21.2
11.4
3.3
2.3
3.3
6.5
-
-
RBL Bank
Neutral
527
-
19,848
1,783
2,309
2.6
2.6
12.7
16.4
41.5
32.1
4.5
4.0
12.8
13.3
-
-
Repco Home Finance
Neutral
808
-
5,052
388
457
4.5
4.2
30.0
38.0
26.9
21.3
4.5
3.8
18.0
19.2
-
-
South Ind.Bank
Neutral
28
-
5,077
6,435
7,578
2.5
2.5
2.7
3.1
10.4
9.1
1.3
1.1
10.1
11.2
-
-
St Bk of India
Neutral
280
-
241,870
88,650
98,335
2.6
2.6
13.5
18.8
20.8
14.9
2.0
1.7
7.0
8.5
-
-
Union Bank
Neutral
151
-
10,373
13,450
14,925
2.3
2.3
25.5
34.5
5.9
4.4
0.9
0.7
7.5
10.2
-
-
Yes Bank
Neutral
1,503
-
68,772
8,978
11,281
3.3
3.4
74.0
90.0
20.3
16.7
3.9
3.3
17.0
17.2
-
-
FMCG
Akzo Nobel India
Neutral
1,817
-
8,712
2,955
3,309
13.3
13.7
57.2
69.3
31.8
26.2
10.4
8.7
32.7
33.3
2.7
2.4
Asian Paints
Neutral
1,117
-
107,157
17,128
18,978
16.8
16.4
19.1
20.7
58.5
54.0
20.4
19.2
34.8
35.5
6.2
5.6
Britannia
Neutral
3,693
-
44,338
9,594
11,011
14.6
14.9
80.3
94.0
46.0
39.3
18.9
14.6
41.2
-
4.5
3.9
Colgate
Neutral
1,087
-
29,554
4,605
5,149
23.4
23.4
23.8
26.9
45.7
40.4
25.3
19.8
64.8
66.8
6.3
5.7
Dabur India
Neutral
302
-
53,198
8,315
9,405
19.8
20.7
8.1
9.2
37.3
32.8
10.4
8.6
31.6
31.0
6.1
5.3
GlaxoSmith Con*
Neutral
5,506
-
23,154
4,350
4,823
21.2
21.4
179.2
196.5
30.7
28.0
8.2
6.9
27.1
26.8
4.7
4.2
Stock Watch
July 10, 2017
Company Name
Reco
CMP
Target
Mkt Cap
Sales ( Čcr )
OPM(%)
EPS (Č)
PER(x)
P/BV(x)
RoE(%)
EV/Sales(x)
(Č)
Price ( Č)
( Č cr )
FY17E FY18E
FY17E
FY18E
FY17E
FY18E
FY17E
FY18E
FY17E
FY18E
FY17E
FY18E
FY17E
FY18E
FMCG
Godrej Consumer
Neutral
972
-
66,186
10,235
11,428
18.4
18.6
41.1
44.2
23.6
22.0
5.2
4.4
24.9
24.8
6.6
5.8
HUL
Neutral
1,098
-
237,604
35,252
38,495
17.8
17.8
20.7
22.4
53.2
49.0
50.8
43.6
95.6
88.9
6.6
6.0
ITC
Neutral
334
-
406,004
40,059
44,439
38.3
39.2
9.0
10.1
37.2
33.0
10.4
9.1
27.8
27.5
9.6
8.7
Marico
Neutral
321
-
41,437
6,430
7,349
18.8
19.5
6.4
7.7
50.2
41.7
15.2
12.7
33.2
32.5
6.3
5.4
Nestle*
Neutral
6,869
-
66,227
10,073
11,807
20.7
21.5
124.8
154.2
55.0
44.6
22.6
20.3
34.8
36.7
6.4
5.4
Tata Global
Neutral
158
-
9,956
8,675
9,088
9.8
9.8
7.4
8.2
21.3
19.2
1.7
1.6
7.9
8.1
1.1
1.0
Procter & Gamble
Neutral
8,019
-
26,029
2,939
3,342
23.2
23.0
146.2
163.7
54.9
49.0
13.9
11.5
25.3
23.5
8.4
7.3
Hygiene
IT
HCL Tech^
Buy
831
1,014
118,583
46,723
52,342
22.1
20.9
60.0
62.8
13.9
13.2
3.5
3.0
25.3
22.4
2.3
1.9
Infosys
Buy
936
1,179
214,994
68,484
73,963
26.0
26.0
63.0
64.0
14.9
14.6
3.1
2.9
20.8
19.7
2.8
2.5
TCS
Accumulate
2,332
2,651
459,543
117,966
127,403
27.5
27.6
134.3
144.5
17.4
16.1
5.2
4.8
29.8
29.7
3.5
3.3
Tech Mahindra
Buy
380
533
37,072
29,141
31,051
14.4
15.0
32.3
35.6
11.8
10.7
2.0
1.8
17.1
17.0
1.1
1.0
Wipro
Accumulate
257
280
124,865
55,421
58,536
20.3
20.3
35.1
36.5
7.3
7.0
1.3
1.1
19.2
14.6
1.7
1.4
Media
D B Corp
Neutral
384
-
7,058
2,297
2,590
27.4
28.2
21.0
23.4
18.3
16.4
4.3
3.7
23.7
23.1
2.9
2.5
HT Media
Neutral
82
-
1,906
2,693
2,991
12.6
12.9
7.9
9.0
10.4
9.1
0.9
0.8
7.8
8.3
0.3
0.2
Jagran Prakashan
Buy
179
225
5,853
2,283
2,555
28.0
28.0
10.6
12.3
16.8
14.6
3.6
3.1
21.4
21.4
2.6
2.3
Sun TV Network
Neutral
830
-
32,707
2,850
3,265
70.1
71.0
26.2
30.4
31.7
27.3
8.1
7.2
24.3
25.6
11.1
9.5
Hindustan Media
Neutral
276
-
2,027
1,016
1,138
24.3
25.2
27.3
30.1
10.1
9.2
1.9
1.7
16.2
15.8
1.3
1.1
Ventures
TV Today Network
Buy
256
344
1,524
608
667
21.5
22.3
15.7
19.2
16.3
13.3
2.5
2.1
16.1
16.0
2.1
1.8
Metals & Mining
Coal India
Neutral
251
-
155,837
84,638
94,297
21.4
22.3
24.5
27.1
10.3
9.3
4.3
4.1
42.6
46.0
1.4
1.2
Hind. Zinc
Neutral
267
-
112,753
14,252
18,465
55.9
48.3
15.8
21.5
16.9
12.4
2.8
2.4
17.0
20.7
7.9
6.1
Hindalco
Neutral
195
-
43,724
107,899
112,095
7.4
8.2
9.2
13.0
21.2
15.0
1.0
1.0
4.8
6.6
0.9
0.9
JSW Steel
Neutral
216
-
52,272
53,201
58,779
16.1
16.2
130.6
153.7
1.7
1.4
0.2
0.2
14.0
14.4
1.7
1.5
NMDC
Neutral
116
-
36,654
6,643
7,284
44.4
47.7
7.1
7.7
16.3
15.1
1.4
1.4
8.8
9.2
3.3
2.9
SAIL
Neutral
62
-
25,462
47,528
53,738
(0.7)
2.1
(1.9)
2.6
23.7
0.7
0.6
(1.6)
3.9
1.4
1.3
Vedanta
Neutral
257
-
95,569
71,744
81,944
19.2
21.7
13.4
20.1
19.2
12.8
1.6
1.5
8.4
11.3
1.7
1.4
Tata Steel
Neutral
554
-
53,786
121,374
121,856
7.2
8.4
18.6
34.3
29.8
16.2
1.9
1.7
6.1
10.1
1.1
1.1
Oil & Gas
GAIL
Neutral
359
-
60,667
56,220
65,198
9.3
10.1
27.1
33.3
13.2
10.8
1.2
1.1
9.3
10.7
1.3
1.1
ONGC
Neutral
160
-
204,883
137,222
152,563
15.0
21.8
19.5
24.1
8.2
6.6
0.7
0.7
8.5
10.1
1.8
1.6
Indian Oil Corp
Neutral
382
-
185,617
373,359
428,656
5.9
5.5
54.0
59.3
7.1
6.5
1.1
1.0
16.0
15.6
0.7
0.6
Stock Watch
July 10, 2017
Company Name
Reco
CMP
Target
Mkt Cap
Sales ( Čcr )
OPM(%)
EPS (Č)
PER(x)
P/BV(x)
RoE(%)
EV/Sales(x)
(Č)
Price ( Č)
( Č cr )
FY17E FY18E
FY17E
FY18E
FY17E
FY18E
FY17E
FY18E
FY17E
FY18E
FY17E
FY18E
FY17E
FY18E
Oil & Gas
Reliance Industries
Neutral
1,491
-
484,743
301,963
358,039
12.1
12.6
87.7
101.7
17.0
14.7
1.7
1.6
10.7
11.3
2.1
1.7
Pharmaceuticals
Alembic Pharma
Buy
515
648
9,715
3,101
3,966
19.7
20.5
21.4
25.5
24.1
20.2
5.1
4.2
23.0
22.8
3.1
2.3
Alkem Laboratories Ltd
Buy
1,822
2,161
21,779
5,853
6,901
17.1
18.4
74.6
85.0
24.4
21.4
5.2
4.3
21.1
20.2
3.7
3.1
Aurobindo Pharma
Buy
697
823
40,830
14,845
17,086
21.5
22.1
39.4
44.7
17.7
15.6
4.4
3.5
27.6
24.7
2.9
2.5
Aventis*
Neutral
4,196
-
9,663
2,206
2,508
16.6
16.8
128.9
139.9
32.6
30.0
5.6
4.4
21.6
23.5
4.1
3.5
Cadila Healthcare
Reduce
516
450
52,856
9,220
11,584
18.4
20.3
14.5
18.7
35.6
27.6
7.6
6.2
23.5
24.6
6.1
4.6
Cipla
Sell
546
461
43,933
14,281
16,619
15.4
16.2
12.5
19.7
43.7
27.7
3.5
3.2
8.4
12.0
3.2
2.8
Dr Reddy's
Neutral
2,705
-
44,833
14,081
15,937
16.1
18.6
72.6
105.9
37.3
25.5
3.7
3.3
9.6
13.6
3.4
3.0
Dishman Pharma
Sell
143
1,718
1,890
22.7
22.8
9.5
11.3
10.1
10.9
3.3
2.9
GSK Pharma*
Neutral
2,574
-
21,805
2,927
3,290
11.8
16.2
34.4
49.6
74.8
51.9
10.9
11.3
13.9
21.3
7.2
6.5
Indoco Remedies
Sell
195
153
1,796
1,067
1,154
12.1
14.9
8.4
11.3
23.2
17.3
2.8
2.5
12.6
15.0
1.9
1.8
Ipca labs
Buy
468
620
5,903
3,211
3,593
13.9
14.5
15.4
19.4
30.4
24.1
2.4
2.2
8.2
9.5
2.0
1.7
Lupin
Buy
1,117
1,526
50,446
17,120
18,657
24.1
24.1
56.9
61.1
19.6
18.3
3.7
3.1
20.7
18.6
3.2
2.6
Natco Pharma
Accumulate
1,007
1,060
17,555
2,065
1,988
33.1
33.7
27.9
25.7
36.1
39.2
10.5
9.0
29.2
22.9
8.6
8.7
Sun Pharma
Buy
550
712
131,887
30,264
32,899
29.0
26.9
32.7
31.6
16.8
17.4
3.6
3.1
22.2
18.7
4.1
3.7
Power
Tata Power
Neutral
82
-
22,098
36,916
39,557
17.4
27.1
5.1
6.3
16.0
13.0
1.4
1.3
9.0
10.3
1.6
1.5
NTPC
Neutral
159
-
131,185
86,605
95,545
17.5
20.8
11.8
13.4
13.5
11.9
1.4
1.3
10.5
11.1
2.9
2.9
Power Grid
Accumulate
209
223
109,497
25,315
29,193
88.2
88.7
14.2
17.2
14.8
12.2
2.2
2.0
15.2
16.1
9.0
8.1
Real Estate
Prestige Estate
Neutral
282
-
10,569
4,707
5,105
25.2
26.0
10.3
13.0
27.4
21.7
2.2
2.0
10.3
10.2
3.4
3.1
MLIFE
Buy
439
522
2,254
1,152
1,300
22.7
24.6
29.9
35.8
14.7
12.3
1.1
1.0
7.6
8.6
2.7
2.3
Telecom
Bharti Airtel
Neutral
385
-
153,760
105,086
114,808
34.5
34.7
12.2
16.4
31.5
23.5
2.1
2.0
6.8
8.4
2.4
2.1
Idea Cellular
Neutral
83
-
30,075
40,133
43,731
37.2
37.1
6.4
6.5
13.0
12.8
1.1
1.0
8.2
7.6
1.8
1.5
zOthers
Abbott India
Neutral
4,286
-
9,108
3,153
3,583
14.1
14.4
152.2
182.7
28.2
23.5
138.3
118.1
25.6
26.1
2.6
2.2
Asian Granito
Accumulate
450
480
1,353
1,066
1,169
11.6
12.5
13.0
16.0
34.6
28.2
3.4
3.0
9.5
10.7
1.6
1.4
Bajaj Electricals
Buy
328
395
3,323
4,801
5,351
5.7
6.2
10.4
13.7
31.5
24.0
3.9
3.5
12.4
14.5
0.7
0.6
Banco Products (India)
Neutral
223
-
1,597
1,353
1,471
12.3
12.4
14.5
16.3
15.4
13.7
21.3
19.2
14.5
14.6
1.1
120.4
Coffee Day Enterprises
Neutral
246
-
5,062
2,964
3,260
20.5
21.2
4.7
8.0
-
30.7
2.8
2.6
5.5
8.5
2.1
1.9
Ltd
Competent Automobiles Neutral
185
-
119
1,137
1,256
3.1
2.7
28.0
23.6
6.6
7.9
35.6
32.2
14.3
11.5
0.1
0.1
Elecon Engineering
Neutral
62
-
692
1,482
1,660
13.7
14.5
3.9
5.8
15.8
10.6
3.7
3.4
7.8
10.9
0.8
0.7
Stock Watch
July 10, 2017
Company Name
Reco
CMP
Target
Mkt Cap
Sales ( Čcr )
OPM(%)
EPS (Č)
PER(x)
P/BV(x)
RoE(%)
EV/Sales(x)
(Č)
Price ( Č)
( Č cr )
FY17E
FY18E
FY17E
FY18E
FY17E
FY18E
FY17E
FY18E
FY17E
FY18E
FY17E
FY18E
FY17E
FY18E
zOthers
Finolex Cables
Neutral
489
-
7,480
2,883
3,115
12.0
12.1
14.2
18.6
34.4
26.3
18.3
16.0
15.8
14.6
2.3
2.1
Garware Wall Ropes
Neutral
916
-
2,004
863
928
15.1
15.2
36.4
39.4
25.2
23.2
4.6
3.9
17.5
15.9
2.2
2.1
Goodyear India*
Neutral
912
-
2,103
1,598
1,704
10.4
10.2
49.4
52.6
18.5
17.3
85.2
74.8
18.2
17.0
1.0
143.3
Hitachi
Neutral
1,984
-
5,395
2,081
2,433
8.8
8.9
33.4
39.9
59.4
49.7
47.9
39.9
22.1
21.4
2.6
2.2
HSIL
Neutral
405
-
2,926
2,384
2,515
15.8
16.3
15.3
19.4
26.5
20.9
26.3
22.6
7.8
9.3
1.4
1.3
Interglobe Aviation
Neutral
1,248
-
45,113
21,122
26,005
14.5
27.6
110.7
132.1
11.3
9.4
67.4
48.2
168.5
201.1
2.1
1.7
Jyothy Laboratories
Neutral
366
-
6,641
1,440
2,052
11.5
13.0
8.5
10.0
43.0
36.6
10.4
9.6
18.6
19.3
4.9
3.4
Kirloskar Engines India
Neutral
394
-
5,691
2,554
2,800
9.9
10.0
10.5
12.1
37.5
32.5
15.7
14.8
10.7
11.7
1.9
1.7
Ltd
Linc Pen & Plastics
Neutral
279
-
413
382
420
9.3
9.5
13.5
15.7
20.7
17.8
3.6
3.1
17.1
17.3
1.1
1.0
M M Forgings
Neutral
677
-
817
546
608
20.4
20.7
41.3
48.7
16.4
13.9
92.8
82.1
16.6
17.0
1.3
1.2
Manpasand Bever.
Neutral
776
-
4,438
836
1,087
19.6
19.4
16.9
23.8
45.9
32.6
5.5
4.8
12.0
14.8
5.0
3.8
Mirza International
Neutral
159
-
1,909
963
1,069
17.2
18.0
6.1
7.5
25.9
21.1
4.0
3.4
15.0
15.7
2.2
2.0
MT Educare
Neutral
67
-
268
366
417
17.7
18.2
9.4
10.8
7.2
6.2
1.6
1.4
22.2
22.3
0.6
0.5
Narayana Hrudaya
Neutral
305
-
6,232
1,873
2,166
11.5
11.7
2.6
4.0
115.3
76.9
7.1
6.4
6.1
8.3
3.4
3.0
Navkar Corporation
Buy
207
265
2,948
347
371
43.2
37.3
6.7
6.0
31.0
34.5
2.1
1.9
6.2
10.6
9.6
9.0
Navneet Education
Neutral
178
-
4,148
1,062
1,147
24.0
24.0
6.1
6.6
29.2
26.8
6.0
5.3
20.6
19.8
4.0
3.7
Nilkamal
Neutral
1,931
-
2,881
1,995
2,165
10.7
10.4
69.8
80.6
27.7
24.0
110.3
95.9
16.6
16.5
1.4
1.3
Page Industries
Neutral
16,897
-
18,846
2,450
3,124
20.1
17.6
299.0
310.0
56.5
54.5
376.3
287.3
47.1
87.5
7.7
6.1
Parag Milk Foods
Neutral
233
-
1,959
1,919
2,231
9.3
9.6
9.5
12.9
24.7
18.0
3.8
3.2
15.5
17.5
1.2
1.0
Quick Heal
Neutral
221
-
1,554
408
495
27.3
27.0
7.7
8.8
28.6
25.2
2.7
2.7
9.3
10.6
3.0
2.4
Radico Khaitan
Accumulate
135
147
1,799
1,667
1,824
13.0
13.2
6.7
8.2
20.3
16.5
1.8
1.7
9.0
10.2
1.5
1.3
Relaxo Footwears
Neutral
515
-
6,189
2,085
2,469
9.2
8.2
7.6
8.0
68.2
64.8
26.4
22.6
17.9
18.8
3.1
2.6
S H Kelkar & Co.
Neutral
262
-
3,786
1,036
1,160
15.1
15.0
6.1
7.2
42.9
36.5
4.6
4.2
10.7
11.5
3.5
3.1
Siyaram Silk Mills
Accumulate
2,215
2,500
2,076
1,574
1,769
12.5
12.7
97.1
113.1
22.8
19.6
3.5
3.0
15.4
15.5
1.5
1.4
Styrolution ABS India*
Neutral
951
-
1,672
1,440
1,537
9.2
9.0
40.6
42.6
23.4
22.3
59.8
54.4
12.3
11.6
1.1
1.0
Surya Roshni
Neutral
289
-
1,265
3,342
3,625
7.8
7.5
17.3
19.8
16.7
14.6
31.7
25.5
10.5
10.8
0.6
0.6
Team Lease Serv.
Neutral
1,445
-
2,470
3,229
4,001
1.5
1.8
22.8
32.8
63.4
44.0
6.8
5.9
10.7
13.4
0.7
0.5
The Byke Hospitality
Neutral
193
-
774
287
384
20.5
20.5
7.6
10.7
25.4
18.1
5.3
4.3
20.7
23.5
2.7
2.0
Transport Corporation of
Neutral
339
-
2,598
2,671
2,911
8.5
8.8
13.9
15.7
24.5
21.7
3.3
3.0
13.7
13.8
1.1
1.0
India
Stock Watch
July 10, 2017
Company Name
Reco
CMP
Target Mkt Cap
Sales ( Čcr )
OPM(%)
EPS (Č)
PER(x)
P/BV(x)
RoE(%)
EV/Sales(x)
(Č)
Price ( Č)
( Č cr )
FY17E FY18E FY17E FY18E FY17E FY18E FY17E FY18E FY17E FY18E FY17E FY18E FY17E FY18E
zOthers
TVS Srichakra
Neutral
3,914
-
2,997
2,304
2,614
13.7
13.8
231.1
266.6
16.9
14.7
439.8
346.3
33.9
29.3
1.3
1.1
UFO Moviez
Neutral
390
-
1,078
619
685
33.2
33.4
30.0
34.9
13.0
11.2
1.8
1.6
13.8
13.9
1.5
1.1
Visaka Industries
Neutral
538
-
855
1,051
1,138
10.3
10.4
21.0
23.1
25.6
23.3
69.0
64.6
9.0
9.2
1.1
1.0
VRL Logistics
Neutral
333
-
3,038
1,902
2,119
16.7
16.6
14.6
16.8
22.9
19.8
5.0
4.4
21.9
22.2
1.7
1.5
VIP Industries
Accumulate
193
218
2,724
1,270
1,450
10.4
10.4
5.6
6.5
34.4
29.7
7.1
6.2
20.7
21.1
2.1
1.9
Navin Fluorine
Buy
3,028
3,650
2,980
789
945
21.1
22.4
120.1
143.4
25.2
21.1
4.1
3.5
17.8
18.5
3.7
3.0
Source: Company, Angel Research; Note: *December year end; #September year end; &October year end; Price as on July 07, 2017
Market Outlook
July 10, 2017
Research Team Tel: 022 - 39357800
DISCLAIMER
Angel Broking Private Limited (hereinafter referred to as “Angel”) is a registered Member of National Stock Exchange of India
Limited,Bombay Stock Exchange Limited and Metropolitan Stock Exchange Limited. It is also registered as a Depository Participant with
CDSL and Portfolio Manager with SEBI. It also has registration with AMFI as a Mutual Fund Distributor. Angel Broking Private Limited is a
registered entity with SEBI for Research Analyst in terms of SEBI (Research Analyst) Regulations, 2014 vide registration number
INH000000164. Angel or its associates has not been debarred/ suspended by SEBI or any other regulatory authority for accessing
/dealing in securities Market. Angel or its associates/analyst has not received any compensation / managed or
co-managed public offering of securities of the company covered by Analyst during the past twelve months.
This document is solely for the personal information of the recipient, and must not be singularly used as the basis of any investment
decision. Nothing in this document should be construed as investment or financial advice. Each recipient of this document should make
such investigations as they deem necessary to arrive at an independent evaluation of an investment in the securities of the companies
referred to in this document (including the merits and risks involved), and should consult their own advisors to determine the merits and
risks of such an investment.
Reports based on technical and derivative analysis center on studying charts of a stock's price movement, outstanding positions and
trading volume, as opposed to focusing on a company's fundamentals and, as such, may not match with a report on a company's
fundamentals. Investors are advised to refer the Fundamental and Technical Research Reports available on our website to evaluate the
contrary view, if any.
The information in this document has been printed on the basis of publicly available information, internal data and other reliable
sources believed to be true, but we do not represent that it is accurate or complete and it should not be relied on as such, as this
document is for general guidance only. Angel Broking Pvt. Limited or any of its affiliates/ group companies shall not be in any way
responsible for any loss or damage that may arise to any person from any inadvertent error in the information contained in this report.
Angel Broking Pvt. Limited has not independently verified all the information contained within this document. Accordingly, we cannot
testify, nor make any representation or warranty, express or implied, to the accuracy, contents or data contained within this document.
While Angel Broking Pvt. Limited endeavors to update on a reasonable basis the information discussed in this material, there may be
regulatory, compliance, or other reasons that prevent us from doing so.
This document is being supplied to you solely for your information, and its contents, information or data may not be reproduced,
redistributed or passed on, directly or indirectly.
Neither Angel Broking Pvt. Limited, nor its directors, employees or affiliates shall be liable for any loss or damage that may arise from
or in connection with the use of this information.